New Data links Outward Investment in Services to Australia’s Services Export Performance
Measurement of trade in services is notoriously difficult. The official statistics on imports and exports contained in the Balance of Payments (BOP) are well known, for example, as measuring poorly at best only three of the four modes of international supply of services. As defined in the WTO, the four modes of trading services are through cross-border supply such as on-line through the internet, consumption abroad such as tourism, commercial presence of an enterprise such as establishing an affiliate in a foreign country to serve the local market, and individuals such as consultants travelling temporarily to a foreign country to provide services.
There has been no official global source of information breaking down services exports into various modes of supply until the World Trade Organisation (WTO) released an experimental dataset in 2019 known as TISMOS (Trade in Services data by Mode of Supply), providing estimates for the period 2005-2017.
The aggregate results for TISMOS confirm WTO estimates of a decade earlier that commercial presence (i.e. establishing an affiliate to serve a foreign market), accounts for almost 60% of the global supply of services. This is now shown to be the dominant mode for all services except transport, education and tourism. It is therefore important for all countries to have good measures of commercial presence.
Only the United States (US) has produced consistent series of ‘Inwards and Outwards Foreign Affiliates Trade in Services (FATS). For countries like Australia without such statistical collections, inward and outward FDI flows into the services sector have offered useful guidance, but could hardly be considered adequate proxies for services exports.
The Australian context
Services business advocacy was largely responsible for initiation by the Australian Bureau of Statistics (ABS) in the early 200Os of a first experimental Australian survey of outward foreign affiliates’ trade.
The results showed that in 2002-03, there were 4,000 Australian-controlled affiliates abroad, generating 300,000 jobs and AUD142 billion in sales, of which AUD65 billion (46%) were in services. At the time, those findings on sales of services (a good proxy for services exports via commercial presence) suggested that the official BOP data was measuring less than one third of Australia’s actual exports of services.
Two decades later, as a result of funding provided in the context of Senator Birmingham’s new ‘Services Export Action Plan’, the ABS released a new collection on Australian Outward FATS on 10 September 2020. This data provides a detailed snapshot picture for 2018-19 but no trend analysis.
I offer some insights into the results, and attempt to read the underlying trends in trade, based on two decades of working closely with the Australian Services Roundtable, the peak industry body in Australia representing the services sector.
What the statistics tell us
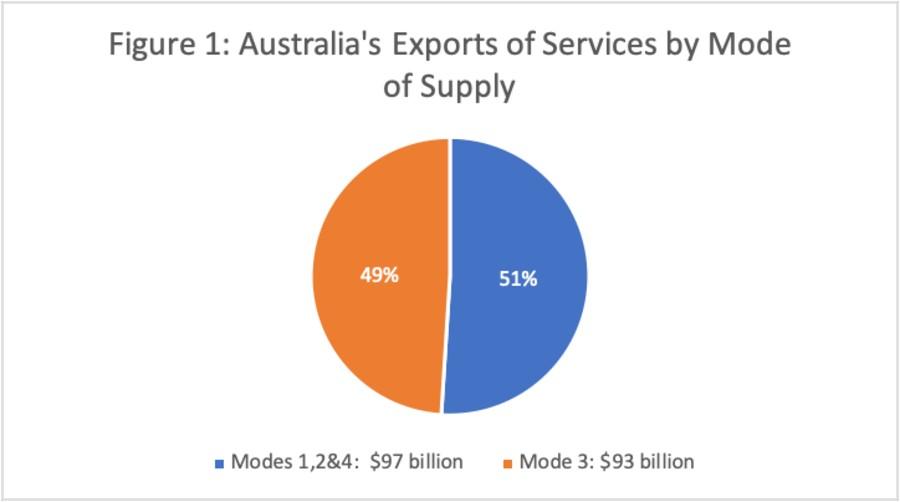
From an export perspective, the most important result is that local sales of services by Australian foreign affiliates (a proxy measure for Australian exports via commercial presence) can now be seen to sit above AUD92 billion. Insurance and pension services account for 25%; financial services another 23%, other business services 20% and construction 12%.
For 2018-19, the BOP puts Australian exports of services at AUD97 billion. But taking over AUD92 billion of sales of services by foreign affiliates into account, the BOP now appears to be measuring roughly half of Australia’s actual services exports, as shown in Figure 1 (own calculations; rounding up based on WTO TISMOS dataset).
These sales of services account for 42% of foreign affiliates total sales of goods and services (down from 46% in 2002-3) but more than 50% of the sales of goods and services in the largest markets, the United Kingdom (UK) and New Zealand (NZ). The latter stands out in particular as a very much larger market for foreign affiliate sales of services rather than goods.
The new ABS data for 2018 confirms a continued dramatic underestimate of services exports in the BOP. But the underestimate is less than the underestimate by two-thirds in 2002-2003. It is too early to tell, but I hazard a guess that we may be seeing in these results the first measured evidence for Australia of the shift from all other modes of supply including commercial presence, to on-line supply of digitally delivered services; a trend set to accelerate post-COVID 19.
Australian foreign affiliates growth and SMEs
There are now more than 5,000 majority Australian-owned affiliates established in foreign markets, 90% of them SMEs and with 275 Australian parent enterprises.
Their total assets amount to AUD2 trillion, of which financial and insurance services providers alone hold over AUD1.5 trillion or 78%. Mining accounts for 10%. Eighteen percent of the foreign affiliates are located in the US; the next largest destinations are the UK and NZ. But 36% of the total assets are held in NZ, 17% in the US and 15% in the UK.
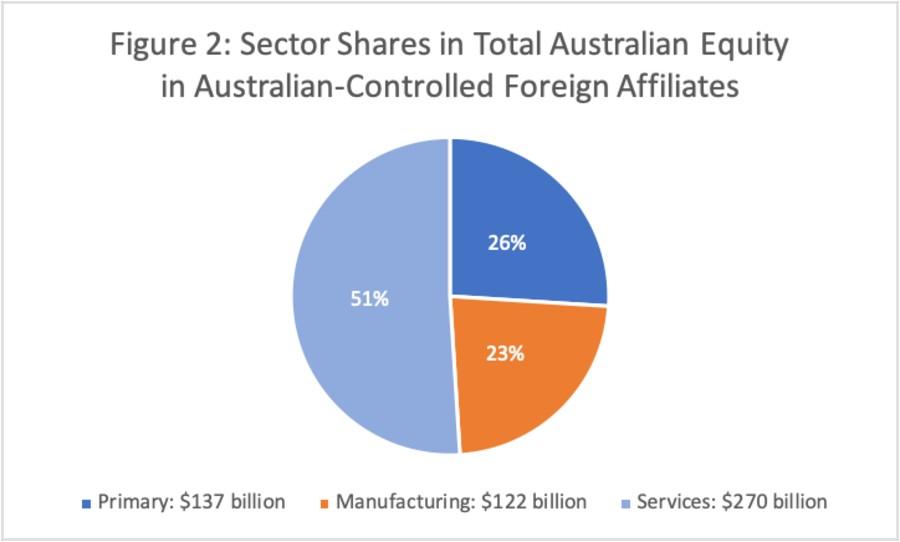
As shown in Figure 2, services industries account for just over half of the total Australian equity in these affiliates. Financial and insurance services alone account for 32%, mining 26% and manufacturing 23%. Measured in terms of the location of Australian equity, the UK is the top destination, followed by the US and NZ.
In terms of industry value added, services account for more than 70%, with financial and insurance services alone accounting for 50%, by themselves more than double the contribution of mining and seven times more than manufacturing. The contribution to industry value added was highest in NZ, nearly double the figure for the US and nearly three times larger than for the UK.
Similarly, services account for two thirds of the 412,000 jobs created by Australian affiliates in destination markets. By themselves, financial and insurance services generate roughly as many jobs abroad as manufacturing. Professional, scientific and technical services by themselves generate nearly as many as mining.
Total operating profits before tax of all Australian-owned foreign affiliates was AUD42 billion, of which financial and insurance services generated the most.
Clearly commercial presence remains of fundamental importance to international business for Australian financial, insurance and pension services providers. This justifies continued trade negotiating efforts to reduce barriers to commercial presence, such as foreign equity caps and restrictions on the composition and residency of senior boards of management.
Australia needs a sustained services trade statistics collection effort
Undoubtedly the business community, academic researchers and trade negotiators do not want to wait another two decades for the next set of statistics.
Under strong industry pressure at the time, the ABS undertook work in 2011 specifically on outward foreign affiliates trade in financial services. But the time has come for the Australian government to prioritise funding of a consistent collection of Foreign Affiliates Trade in Services (FATS).
Jane Drake-Brockman is Industry Professor with the Institute for International Trade and Founder of the Australian Services Roundtable, which in 2020 celebrates its 20th anniversary.
The views expressed here are the authors, and may not necessarily represent the views of the Institute for International Trade.
This work is licensed under Commons Attribution-NonCommercial-NoDerivatives 4.0 International License.
IIT is a global leader in researching, analysing and commenting on International Trade.
Stay informed about our up-and-coming seminars, events, publications, awards, new projects and collaborations, and other exciting news.